Author: seddryck

First steps with Gremlin to query a graph loaded in Azure Cosmos DB

In previous blog posts, I explained the use-case and also how to load data into an Azure Cosmos DB graph database with the bulk executor library. This blog post is dedicated to explain how to perform basic queries with Gremlin on this dataset.

You can use two tools to query a graph hosted by Azure Cosmos DB. The first tool is embedded in the Azure Portal and is named Data Explorer.

cosmos-data-explorer

The second tool is an extension of Visual Studio Code that is freely available and is named Azure Cosmos DB. This extension let you browse and query your MongoDB databases both locally and in the cloud using scrapbooks but also to write queries in Gremlin and display results as a Graph or as JSON documents.

cosmos-visual-code-extension

Before we go further, a little bit of theory about the Gremlin query language.

  • Each query is starting by g
  • V() stands for vertices and returns one or more vertices
  • E() stands for edges and returns one or more edges
  • hasLabel("label") filter Vertices/Edges based on label (type)
  • hasId("id") filter Vertices(/Edges) based on Id (must be unique)
  • has("propertyName", "value") filter Vertices based on value of any property

With these few elements, it’s already possible to write some interesting queries. The two first queries will respectivelly retrieve all the bouts and all the karatekas:

g.V().hasLabel("bout")
g.V().hasLabel("karateka")

If you want to retrieve a specific karateka and you know her id, you can apply the two variantes. It will return a unique result.

g.V().hasId("karateka.1") 
g.V("karateka.1")

The graph view is not really providing a value

cosmos-query-id-graph

But the JSON view, offer the opportunity to confirm that when returning a vertex, we’re also returning each of the properties!

cosmos-query-id-json

Most of the time, you don’t know the if of a vertex and you’ll need to perform a search through the graph to find it. In the first example, we’re looking for a karateka named Alice and in the second we’re looking for two karatekas.

g.V().has("karateka", "fullName", "Charlier, Alice") 
g.V().has("karateka", "fullName", 
   within(["Charlier, Alice", "Charlier, Clémence"]))

The first query is identical in terms of result to the following query:

g.V().has("fullName", "Charlier, Alice")

But the first version is more performant. Indeed, by specifying that you’re looking for a karateka, the engine will avoid to search within all the vertices that have not the label karateka. It’s a best practice to always specify this information when possible.

In the next blog posts we’ll see how to add or remove some properties to a vertex or and edge.

Loading data into an Azure Cosmos DB graph database with the bulk executor library

In a previous blog post, I started to explain how to model karate tournaments’ results within a graph database. Now, we’ll see how we can efficiently load these data into Azure Cosmos DB with the bulk executor library. This library allows you to perform bulk operations in Azure Cosmos DB through bulk import and bulk update APIs (currently limited to SQL and Gremlin API).

One of the biggest benefits to use this library, is that you don’t need to handle rate limiting of request, request timeouts, and other transient exceptions. This library is doing these tedious tasks for you. Another good point is the fact that it significantly reduces the client-side compute resources needed to saturate the throughput allocated to a container.

For this case, my data are stored in a kind of flat file. I’ll explain the format here under but if you want to see the full picture, that’s an intermediatory file with raw data but already aligned with the structure
of my graph. In this file, you’ll find a section defining karatekas, another tournaments but also bouts, divisions etc. All these entities are vertices and each section will start by the label of the set of vertices between brackets. The next line will contain the name of the properties separated by a semi-column(;). following lines, contain all the vertices and their respective properties.

[tournament]
id;name;date
1;FFKAMA Championship 2017;2017-01-29
2;FFKAMA Championship 2018;2018-01-28
3;GFK Championship 2018;2018-04-15
...

The transition between two set of vertices or between is marked by an empty line.

The label of a set of edges is identified by starting with a dash (-) and ending with a dash and a greater than symbol (symbol of an arrow). Expl: - belongs to ->. Same than vertices, second line identifies the properties. Two important properties are assigned to any edge, the source and the destination. These two properties are vertices and are identified by as such by brackets surrounding the name of the property. They are always located as first and second properties.

-loses->
[karateka];[bout];point;senshu
33;67;0;
75;68;
30;69;4;false
...

The example above represents the edges labeled “loses”. These edges represent one the possible links between a karateka (source) and a bout (destination). Both source and destination are identified by their corresponding id. As you can see each property, except the source and destination, can be unset.

Now that we’ve our flat file to import, we’ll need to write a reader. This reader is implemented in the class GraphCsvReader. This reader will retrieve the labels and properties for each vertex and edge stored in the flat file. Once read, all these information will be transformed to vertices or edges. That’s the role of the class CosmosDbBulkGraphBuilder. Once we’ve these objects, we’ll forward them to the bulk execution library provided by Microsoft in order to load them in Azure Cosmos DB. This library is leveraged in the class CosmosDbBulkWriter.

read-transform-bulk-load-process

A few key insights about the code of CosmosDbBulkWriter.

If you’re familiar with SqlConnection or OleDbConnection for SQL Server or most of the relational databases, you could be surprised to not find the equivalent for Azure Cosmos DB. The best match with the notion of connection is the class DocumentClient. It represents a client-side logical representation for the Azure Cosmos DB. This client is used to configure and execute request against the service.

The GraphBulkExecutor, provided by the bulk executor library, is the class effectively bulk loading the data to Azure Cosmos DB. Before instantiating and initializing an object of this type, you should set the retry options of the DocumentClient to high values. After the initialization, you can reset them to lower values. Indeed, the initialization of a GraphBulkExecutor will probably request a higher workload than usual on your Azure Cosmos DB account and generate some internal and hidden throttled requests.

If you want more details about the code, feel free to take a look in the GitHub project. About performances, the dataset that I’m using has around 3000 (676 vertices and 2323 edges). In terms of entities, it means more than 200 karatekas, results of 350 bouts, ranking for 130 karatekas (I didn’t load the ranking of a tournament if I had the results of each bouts) belonging to 25 tournaments. To read my flat file and create vertices and edges on client side, I need less than 70ms … extremely fast. For the loading time, it depends of how many RU/s you’ll assign to your collection.

If you’re assigning 400 RU/s, you’ll need around 45s. Switching to 800 RU/s will let you wait during 22s. Scaling up to 2000 RU/s, will decrease the time to load the dataset to around 8.5s. That’s inline with the first results … if I check how many RU/s are consumed during the first two attempts, I’ll have around 400 RU/s and 2000 RU/s … logical. Changing the settings to 8000 RU/s will only decrease the time required to load the dataset to 4.5 sec … meaning that I’m limited to an effective value of 4300 RU/s! The main reason for this is that my client is the bottleneck and is not able to send the data at the speed that Azure Cosmos DB can consume them.

cosmos-load-time

Now that we’ve loaded the dataset, we’ll see how to query this database with the use of Gremlin in the next blog post.


Encrypting connection strings for NBi

In some companies encryption of the connection strings and other security-related information is required and checked security policies. NBi is supporting these requirements and offers the opportunity to encrypt the connection-strings in the config file. NBi is trying to not reinvent the wheel and, as such, is relying on the .Net framework native features for the encryption of the connection strings.

The first step to consider when using encrypted connection strings is to move them to the config file. In your test-suite you should find the following reference to a connection string named myDB:

<settings>
  <default apply-to="system-under-test">
    <connectionString>@myDB</connectionString>
  </default>
</settings>

And in the config file, you should have the information about the myDB connection string:

<configuration>
  <configSections>
    <section name="nbi" type="NBi.NUnit.Runtime.NBiSection, NBi.NUnit.Runtime"/>
  </configSections>
  <nbi testSuite="TestSuite.nbits"/>
  <connectionStrings>
    <add name="myDB" connectionString="Provider=SQLNCLI11;Server=****.database.windows.net;Database=AdventureWorks2012;UId=****;Pwd=****;" />
  </connectionStrings>
</configuration>

The following walkthrough is using the RsaProtectedConfigurationProvider. This provider uses RSA encryption to encrypt and decrypt configuration data.
Before you and the user running your test-suite can decrypt encrypted information in the config file, their identity must have read access to the encryption key that is used to encrypt and decrypt the encrypted sections. This walkthrough uses the default RsaProtectedConfigurationProvider provider that is specified in the Machine.config file and named RsaProtectedConfigurationProvider. The RSA key container that is used by the default RsaProtectedConfigurationProvider provider is named NetFrameworkConfigurationKey.

To grant Read Access to an RSA Encryption Key, you’ll need to use aspnet_regiis. This utility can be found in any version of the .Net framework installed on your machine. The latest version is available at C:\Windows\Microsoft.NET\Framework\v4.0.30319. Granting read access to the user xyz can be executed with the following command (you probably need admin rights to successfully execute this command):

aspnet_regiis -pa "NetFrameworkConfigurationKey" "xyz"

Once, read access granted to your development account don’t forget to also add the account executing your test-suite (if they are different accounts).

Next step is to rename you config file to web.config. It could sound weird but the encryption tool is not looking for other files than web.config files!

After renaming your config file to web.config, you’ll need to use aspnet_regiis again to encrypt your file. Use the following command:

aspnet_regiis -PeF "connectionStrings" "C:\Full Path\MyTestSuite"

Note that the name of section connectionStrings is case-sensitive! Take into account the “S” in upper case. You should also be careful with the last parameter setting the path of your project (and not the path of your config file). Last but not least the path of your project shouldn’t contain a backslash “\” at the end.

Now, you should open the web.config file and you’ll find the following section:

<connectionStrings configProtectionProvider="RsaProtectedConfigurationProvider">
  <EncryptedData Type="http://www.w3.org/2001/04/xmlenc#Element"
    xmlns="http://www.w3.org/2001/04/xmlenc#">
    <EncryptionMethod Algorithm="http://www.w3.org/2001/04/xmlenc#tripledes-cbc" />
    <KeyInfo xmlns="http://www.w3.org/2000/09/xmldsig#">
      <EncryptedKey xmlns="http://www.w3.org/2001/04/xmlenc#">
        <EncryptionMethod Algorithm="http://www.w3.org/2001/04/xmlenc#rsa-1_5" />
        <KeyInfo xmlns="http://www.w3.org/2000/09/xmldsig#">
          <KeyName>Rsa Key</KeyName>
        </KeyInfo>
        <CipherData>
          <CipherValue>aloQVZs+EU3icflVqx+kl9TgCrJZ+qw+fMG5zu0y5SbjkflNgOPtv/Id0H07jNHW5QXA5dcTUa8vMXb4evJMqv281/PTnTq9D4+YtpS5n2eeoGNrlkenHA4L2hOkwbO5A5M8hRAm6MMCjWuvmIgxnczH+BY6tAMAfyU53cjkeWyYOL5SBbmeq0iZ3xcm256VDojqQUdddhuLzlBDQ/FPKeDEJhV9TsbQmaWxmkQ7ftWKsVrhgkzIiqlVjyUw/KM6S2iW/CwayOXhyOZhxYqZAVy6BmaE943/Hoky/UG8E1aOaLBrmUEt+ahl7hru/RZb2wNacGqCO5y+X8TqFdpk0g==</CipherValue>
        </CipherData>
      </EncryptedKey>
    </KeyInfo>
    <CipherData>
      <CipherValue>b2K1WbCd+0mOj5L6xL3ZczWqsgNwdV/RP6jqEA7U2ULYigXF7VccUS7LP7FIRGfVWPcgxQvVHTXanvfY+HKv6J8QfJV7IUopcrn9PYZYQBjm5gZ61AZA5ePfI16GaLsoPk4+VGyxjNCXwoaNSRLgUotA5vyA1cb7VuKKbGZMYixb7L9xPUj9sm5kb9r2PLGjjWDBKhGKBTxn6dGDnUHMjaBk1IXixuj8z1kx4l4CwvUtyLExddeWVu32PkgkIczlzxNb5VG11lI3M6KcptI/fkCCg9Vs/ZFd</CipherValue>
    </CipherData>
  </EncryptedData>
</connectionStrings>

Your connection string is now encrypted. You can reverse the encryption by using the following command:

aspnet_regiis -PdF "connectionStrings" "C:\Full Path\MyTestSuite"

To use your encrypted config file (don’t forget to re-encrypt it if you just decrypt it), you’ll need to rename it to the original name.

Then, just run your test-suite! Nothing else to configure. with the help of native .Net features, NBi will understand that the config file is encrypted, where the encryption key is stored and how to decrypt it.

Extracting key phrases with the Text Analytics API and Power BI

On a previous series of blog posts, I explained how to grab the list of Data Platform MVPs from a website and add additional data about them as such as their GitHub contributions. My last article also explained how to use the Face API to guess the gender of these MVP. I’ll now parse their biography to extract key phrases and display the most used themes in these texts. To support this need, I’ll use the Text Analytics API provided by Azure Cognitive services.

The Text Analytics API is a suite of text analytics web services built with best-in-class Microsoft machine learning algorithms. The API can be used to analyze unstructured text for tasks such as sentiment analysis, key phrase extraction and language detection. No training data is needed to use this API; just bring your text data. This API uses advanced natural language processing techniques to deliver best in class predictions.

The first step of this exercice is to grab the biography. We previously discussed how to parse a web page and retrieve pertinent information. In that case we need to look for the html tag <pre>, extract the text and clean it up.

let
    GetBiography = (url as text) as text=>
let
    source = Web.Contents(url),
    lines = Lines.FromBinary(source),
    biography = List.Select(lines, each Text.Contains(_, "<pre>")){0},
    cleanedBiography = ConvertHtmlSpecialChars(Text.BeforeDelimiter(Text.AfterDelimiter(Text.Clean(Text.Trim(biography)),">"), "<"))
in
    try cleanedBiography otherwise ""
in
    GetBiography

We need to setup a Text Analytics API on our Azure account. If you don’t know how to do this refer to the previous article of this series. About pricing, selecting the free (FO) possibility is probably the best approach. We’ll have a very limited usage of this API with just one call by run.

text-analytics-api-pricing.png

Indeed, at the difference of the Face API, we don’t need to perform a call for each MVP to the Text Analytics API. We only need to call this API once with all the biographies. The API is expecting an list of records (with the language, an id and the biography). The language will always be “en” (standing for English) and for the id, we’ll use the MvpId. Preparing this structure is performed in a function PrepareKeyPhrases.

let
    PrepareKeyPhrases = () =>
let
    source = Table.SelectColumns(#"All info",{"MvpId", "Biography"}),
    filtered = Table.SelectRows(source, each [Biography] <> ""),
    addEnglish = Table.AddColumn(filtered, "language", each "en"),
    renamed = Table.RenameColumns(addEnglish,{{"Biography", "text"}, {"MvpId", "id"}}),
    reordered = Table.ReorderColumns(renamed,{"language", "id", "text"}),
    list = Table.ToRecords(reordered)
in
    list
in
    PrepareKeyPhrases

Once we have the expected input for the query, we just need an additional function to call the Text Analytics API and the method keyPhrases. This power query-m function will be named GetKeyPhrases, receive in parameter the result of PrepareKeyPhrases and will use the same approach than for the Face API, detailed in this article. The most complex part of this query is to transform the structure (list of records) that we previously prepared to a Json text. We can achieve this by transforming the structure to a Json document with Json.FromValue and then we need to serialize this by transforming our newly created binary to text with the help of Text.FromBinary.

let
    GetKeyPhrases = (list as list) =>

let
    headers = [#"Content-Type" = "application/json", #"Ocp-Apim-Subscription-Key" = TextApiKey],
    jsonText = Text.FromBinary(Json.FromValue(list)),
    content = "{ ""documents"": " & jsonText & "}",
    source = Web.Contents(TextApiUrl, [Headers = headers, Content=Text.ToBinary(content)])
in
    source
in
    GetKeyPhrases

We’ll need to provide a table for these keyPhrases. This new table will be linked to the main table with all the MVP details in the model.

let
    source = GetKeyPhrases(PrepareKeyPhrases()),
    json = Json.Document(source,65001)[documents],
    toTable = Table.FromList(json, Splitter.SplitByNothing(), null, null, ExtraValues.Error),
    expandColumns = Table.ExpandRecordColumn(toTable, "Column1", {"id", "keyPhrases"}, {"MvpId", "Word"}),
    expandList = Table.ExpandListColumn(expandColumns, "Word"),
    nonNullRows = Table.SelectRows(expandList, each [Word] <> null),
    capitalized = Table.TransformColumns(nonNullRows,{{"Word", Text.Proper, type text}}),
    cleaned = Table.TransformColumns(capitalized,{{"Word", Text.Clean, type text}}),
    trimmed = Table.TransformColumns(cleaned,{{"Word", Text.Trim, type text}})
in
    trimmed

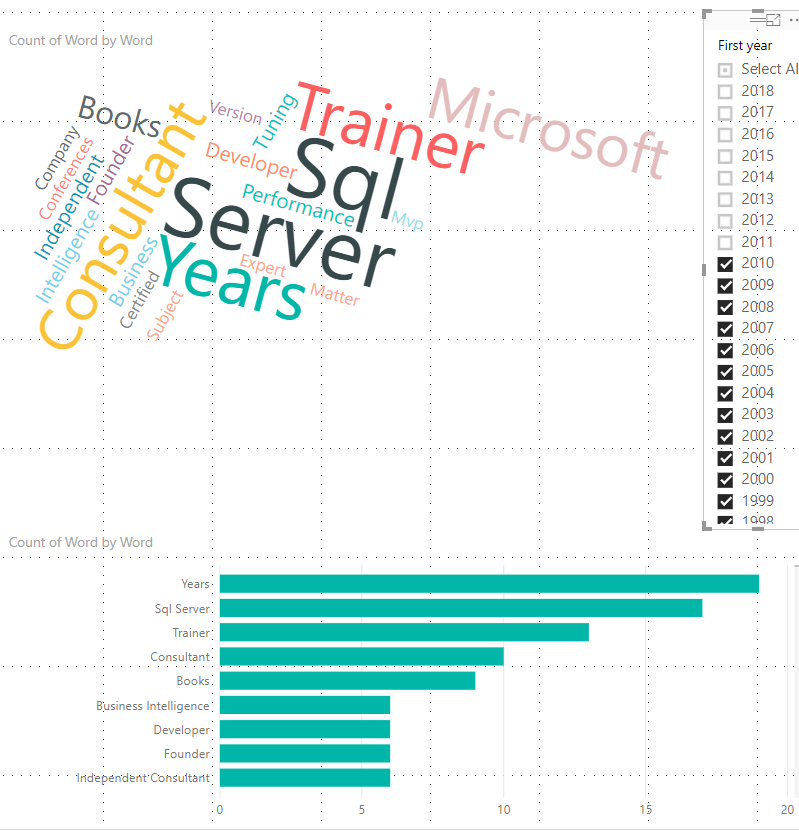
Now that we’ve this list of keywords, we can freely use the Word Cloud custom visual.

text-analytics-word-cloud.

It’s interesting to compare some of the keywords extracted for the recently awarded MVPs.

text-analytics-api-new-mvp

and the long time MVPs.

text-analytics-api-long-time-mvp

At a first sight, book sounds as a keyword associated to long-time MVP and Power BI to the recently awarded.

Using the Face API with Power BI

On a previous series of blog posts, I explained how to grab the list of Data Platform MVPs from a website and add additional data about them as such as their GitHub contributions. In this sequel, I’ll also add the gender of the MVPs … based on their profile picture. To achieve this I’ll rely of the Face API, part of the Azure Cognitive Services.

Let’s start by creating a service on your Azure subscription. If you have no Azure subscription don’t panic, you can create a new one and you’ll receive some free credits to try a few services including the Face API. Also, if you want, you can use the Face API for free with the level of service F0 limiting the calls by minute to twenty.

To create a Face API service in your subscription, click on “add resources” and search for “face”, select the Face API:
face-api

Then select the Face service in the list:
face-api

After this selection, give a name to your service, select the resources group and make a choice about the level of service that you’re expecting:

face-api-pricing

Now, we’ll go back to Power BI and we’ll create a new query, To be exact a new function in Power Query. This function will call the Face API passing in parameter the url of the picture. the return will be a text with the possible values: male, female or unknown. I can already create two parameters related to the Face API:

  • The base url dependent of where your service is hosted. I named this parameter FaceApiUrl. This information is located in the Azure portal, in the overview of your Face API service. face-api-url
  • The key of your service. I named this parameter FaceApiKey and the value is also located in the Azure portal but in the keys section.face-api-key

Based on the documentation of the Face API, I’ll have to send a POST request to the service. The request must be sent to a base url and specifying what are the expected parameters computed by the API. In this specific case I’m only interested by the gender. I can build a record for query parameters:

query = [#"returnFaceAttributes"= "gender"]

As previously explain by Chris Webb (blog post) or Erik Svensen (blog post) to submit a post request you’ll need two tricks.

  1. You must specify a content. This action will switch the execution context of Web.Contents from a GET request to a POST request
  2. The text of the content must be transformed to a binary

To create the content, I’ll have to refer to the documentation of the Face API and I need to create a Json document with just one attribute the url of the picture.

content = "{ ""url"": """ & url & """}"

To submit a valide request, I’ll also have to submit the correct key (credential) to the Face API and specify that my content-type is an application/json. These two information must be specified in the headers of my request. The field headers is also expecting a record so I’ll submit the following construction.

headers =
   [#"Content-Type" = "application/json",
   #"Ocp-Apim-Subscription-Key" = FaceApiKey]

Now that the different components of my request are built, i just need to invoke the request with the help of the function Web.Contents().

response = Web.Contents(
   FaceApiUrl,
   [
      Query = query,
      Headers = headers,
      Content=Text.ToBinary(content)
   ]
)

Once we get the response, we just to parse it to extract the gender.

gender = Json.Document(source,65001){0}[faceAttributes][gender]

The complete method should handle some unexpected errors such as picture missing or the quality of the picture is not high enough and it’s not possible to detect the gender.

let
   GetGender = (url as text) =>
let
   query = [#"returnFaceAttributes"= "gender"],
   headers = [#"Content-Type" = "application/json", #"Ocp-Apim-Subscription-Key" = FaceApiKey],
   content = "{ ""url"": """ & url & """}" ,
   source = Web.Contents(FaceApiUrl, [Query = query, Headers = headers,    Content=Text.ToBinary(content)]),
   gender = Json.Document(source,65001){0}[faceAttributes][gender]
in
   try gender otherwise "unknown"
in
   GetGender

At the end, I’m able to create this visual and see that the percentage of women in the Data Platform MVP is still really low.

face-api-gender

Analyzing sport results with a graph and Azure Cosmos DB

On previous blog posts, I made usage of Power BI to analyze the results of my daughters participating in gymnastics competitions. On this new series, I’ll analyze their results in karate (kumite to be precise) … using a larger set of tools: Azure Cosmos DB, Power BI and Azure Databricks.

Let’s start with the analysis to perform: I want to understand their results (is it an expected defeat or is it something that could be set as a counter-performance) or predict them (what’s the likelihood that we must stay at the sport hall until the podium ceremony).

Before going further, a few things that you should know about Karate tournaments before diving into the results:

  • The process is the same than in any Tennis tournament: bout’s winner goes the next round and loser is out.
  • At the exception that if you’ve been defeated by someone going to the final, you’ll be enlisted for a second stage with other competitors defeated by the same finalist and you’ll run for the bronze medal
  • It means that you’ve two bronze medals (because you’ve two finalists) and not one
  • There is always a bout’s winner: in case of draw at the end of the time allocated to a bout, the first competitor who scored is the winner (it’s a bit more complex but let’s keep this simple). This advantage is named “senshu”. In case of 0-0, judges will take the decision
  • Categories are based on age. In most sports, your age is determined based on your birth year … not in Karate where it’s based on your birthdate. It means that you can be in the same category than another competitor during months and suddenly, in the middle of the season, be in another category just because one of you get his birthday.
  • Categories are based on weight. But the bounds for the weight are not the same at each tournament, and the weight is also something really dynamic with children.

Who thought that it would be easy to analyze? Based on the last bullets, I took the decision to collect all the results of the categories surrounding the age of my daughters (hopefully, they are twins) and I’ll take all the sub-categories based on weight.

Based on sportsML wording all the karatekas participating in the same category of a tournament are part of a division.

Now, that we have our goal and some rules, let’s download the results. We’ve a major issue: results are partial. For some competitions, you only have the podium. It means that for some tournaments, I’ve no notion of bouts’ result but just the final standing.

Based on that, we’ve the following (main) entities: we’ve the tournament, the category (age/weight) derived into a division, the bouts (part of a round and a stage) and the competitors (karatekas). For the relations, we’ve: participates/wins/loses (between karatekas and bouts), belongs to (between tournament, divisions, stages, rounds and bouts), ranks (between karateka and a division). I could go further gathering information about club and nationalities but it’s out-of-scope at this point.

I took the decision to model this as a graph. Why? Three important factors drove me to this choice:

  • First argument, I’m not really interested by the entities but more by their relations. That mostly exclude column-based and document models.
  • Second argument, I’ll look for patterns such as “Who has been defeated by A and has defeated C?”
  • karate-query-1

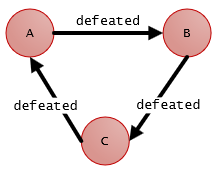
    or have we got any cycle such as “A defeated B who defeated C but A defeated C”.

    karate-query-2
    This kind of queries are complex to model in SQL compared to graph query languages (Gremlin or Cypher).

  • Last argument: the partial results. A graph can easily handle partial information with its schema-less approach. You shouldn’t consider this argument with a storage point-of-view (I’m aware of the null value in relational databases). This argument makes sense if you consider that the relations could be inferred in a graph and that is harder to put in place with a relational model.

 
Based on consideration above my schema looks like:
karate-full-schema

As you could see, the “defeated by” used in the query above is something that could be inferred by the pattern wins/loses between two karatekas and a bout.

karate-inferred-relation

In next post, I’ll explain how to load the dataset with the Azure Cosmos DB bulk executor library, then I’ll cover how to query the database with Gremlin to get the first insights about my daughters’ results.

Generating tests requiring a synchronous iteration over multiple arrays with genbiL

Todays’ challenge is to create a test-suite, with genbiL, where each test is a all-rows assertion with an undetermined count of predicates. The predicates will be combined with an or operator. Pragmatically, each test will have the following pattern for the assertion:

<all-rows>
  <combination operator="or">
    <predicate operand="...">
      <equal>...</equal>
    </predicate> 
  </combination>
</all-rows>

In the second part of this blog post, I already explained how to deal with multiple values for a variable of the template … what’s different? The case that we’re facing is somewhat similar but not identical. In the previous blog post, each variable of the template (.nbitt) was set to an array by genbiL and the template iterated over the values of the array. But the iterations were independent of each other.

If you take a look to the predicate case that we’re facing now, we haven’t one value to iterate over but two: the operand(attribute of the xml element predicate) and the reference (value between the equal elements). Much more important, we need to iterate synchronously between these two values. It means that each time I iterate for a value of the operand, I also need to iterate over a value for the reference. Let’s take a tangible case: my first predicate would be on field “foo” and I want to check if this field is equal to “1”. My second predicate is on field “bar” and will check if this field is equal to “5”. This should lead to the following assertion:

<all-rows>
  <combination operator="or">
    <predicate operand="foo">
      <equal>1</equal>
    </predicate> 
    <predicate operand="bar">
      <equal>5</equal>
    </predicate> 
  </combination>
</all-rows>

That clearly means that if I create a template-variable named operand and set it with values foo and bar and a second template-variable named reference to set with values 1 and 5. I can’t first iterate on the first variable and then on the second variable or I’d have something such as:

<all-rows>
  <combination operator="or">
    <predicate operand="foo">
    </predicate> 
    <predicate operand="bar">
    </predicate> 
      <equal>1</equal>
      <equal>5</equal>
  </combination>
</all-rows>

Hopefully, StringTemplate is a powerful engine and manage this kind of synchronous iterations over two or more arrays (StringTemplate use the wording multi-valued attribute and not array). To achieve that, you’ll need to define an anonymous-template in your template and specify two variables to this anonymous-template.

$xArray,yArray:{ x,y | ...}$

This syntax means that you want to synchronously iterate over two arrays. This template iterates max(n,m) times where n and m are the lengths of xArray and yArray, respectively.

In our specific case the anonymous-template will be:

$operands,references:{operand,reference|<predicate operand="$operand$">
          <equal>$reference$</equal>
        </predicate> 
        }$

There is nothing fancy in the genbiL code to do to support this kind of template, just load the cases and transform some variables into arrays.

case load file 'Acceptance\GenbiL\Resources\Predicate.csv';
case split columns 'operands', 'references' with value '/';

template load file 'Acceptance\GenbiL\Resources\Predicate.nbitt';
suite generate;
suite save as 'Acceptance\GenbiL\Resources\Predicate.nbits';

The csv file would be (.csv):

operands;references
foo/bar;1/5

and the full template (.nbitt):

<test name="All rows from '$field$' validate the rules.">
  <trait name="template-name">predicate.nbitt</trait>
  <system-under-test>
    <resultSet>
      <query>
        select * from myTable
      </query>
    </resultSet>
  </system-under-test>
  <assert>
    <all-rows>
      <combination operator="or">
        $operands, references:{operand, reference|<predicate operand="$operand$">
          <equal>$reference$</equal>
        </predicate> 
        }$
      </combination>
    </all-rows>
  </assert>
</test>

Using NBi with hierarchy’s level in MDX queries

NBi is a toolset dedicated to test BI and data-centric applications. One of the key feature is to compare the results returned by two queries. This can be used to compare the result of a query on the relational datawarehouse and on the OLAP cube. A pitfall that you could face when using NBi with MDX queries is the count of columns returned by this kind of query when a hierarchy’s level is defined on an axis.

When executing the following query (on the Adventure Works 2012 sample database/cube), you’ll see two columns in the result displayed by SSMS. It’s probably what you’re expecting, you’re only selecting one specific level of the hierarchy [Date].[Calendar Date] and one measure.

hierarchy_ssms

You’re probably expecting that NBi will also consider two columns. Unfortunately, it’s not the case: NBi will consider 4 columns! What are the additional and unexpected columns? The [Date].[Calendar].[Calendar Year] and [Date].[Calendar].[Calendar Semester] are also returned. In reality, this is not something specific to NBi, it’s just the standard behaviour of the ADOMD library and SSMS is cheating when only displaying one column for the level!

If we don’t care about this specificity of NBi and setup a test where the MDX query is the system-under-test, then we’ll have to face the following exception

NBi.NUnit.Runtime.CustomStackTraceErrorException :
The column with index '[Date].[Calendar].[Calendar Semester].[MEMBER_CAPTION]'
 is expecting a numeric value but the first row of your result set contains a value 'H1 CY 2008'
 not recognized as a valid numeric value or a valid interval.

Hierarchy_UnexpectedColumns

When comparing the second column of your assertion (the orders’ count so the value, so by default a numeric value) to the second column of your system-under-test (what you’re expecting to be the orders’ count but is in reality the [Date].[Calendar].[Calendar Semester]) … NBi is not able to convert “H1 CY 2008” to a numeric value.

To overcome this issue, the easiest is to fake in the SQL query the additional columns returned by the MDX query. In place of having the following SQL query on your assertion:

select
	, 'Q' + cast([CalendarQuarter] as char(1)) + ' CY 2008' as QY
	, count(distinct SalesOrderNumber)
from
	dbo.factInternetSales f
inner join
	Dimdate d
	on d.DateKey = f.OrderDateKey
where
	f.OrderDateKey between 20080000 and 20089999
group by
	[CalendarQuarter]

Just fake the two additional columns filling them by NULL.

select
	null as [Year]
	, null as [HY]
	, 'Q' + cast([CalendarQuarter] as char(1)) + ' CY 2008' as QY
	, count(distinct SalesOrderNumber)
from
	...

But it’s not the end! You’ll have to inform NBi that it shouldn’t care about these two additional columns. It can be done in the equalTo element where you can specify to ignore some columns. Ignoring means that these columns are not keys and neither values … they don’t interfere in the comparison process. To successfully implement that you’ll define the role as ignore for these columns.

<equalTo keys="all-except-last">
   <column index="0" role="ignore"/>
   <column index="1" role="ignore"/>
   <query>
      select
        null as [Year]
        , null as [HY]
        , 'Q' + cast([CalendarQuarter] as char(1)) + ' CY 2008' as QY
        , count(distinct SalesOrderNumber)
      from
        ...

Now that you expectly said to NBi that he should expect four columns and don’t care about the two firsts, you’ll be able to run your test and find real issues or success!

NBi.NUnit.Runtime.TestSuite.Order's count by Quarter Year for CY 2008:
NBi.NUnit.Runtime.CustomStackTraceAssertionException : Execution of the query doesn't match the expected result 

  Expected: 
Result-set with 3 rows

     #0 (Column1) | #1 (Column2) | #2 (Column3) | #3 (Column4)   
     (Text)       | (Text)       | KEY (Text)   | VALUE (Numeric)
     ------------ | ------------ | ------------ | --------------- 
     (null)       | (null)       | Q1 CY 2008   | 6080           
     (null)       | (null)       | Q2 CY 2008   | 6886           
     (null)       | (null)       | Q3 CY 2008   | 976            


  But was:  
Result-set with 3 rows

     #0 ([Date].[Calendar].[Calendar Year].[MEMBER_CAPTION]) | #1 ([Date].[Calendar].[Calendar Semester].[MEMBER_CAPTION]) | #2 ([Date].[Calendar].[Calendar Quarter].[MEMBER_CAPTION]) | #3 ([Measures].[Order Count])
     (Text)                                                  | (Text)                                                      | KEY (Text)                                                 | VALUE (Numeric)              
     ------------------------------------------------------- | ----------------------------------------------------------- | ---------------------------------------------------------- | ----------------------------- 
     CY 2008                                                 | H1 CY 2008                                                  | Q1 CY 2008                                                 | 6082                         
     CY 2008                                                 | H1 CY 2008                                                  | Q2 CY 2008                                                 | 6886                         
     CY 2008                                                 | H2 CY 2008                                                  | Q3 CY 2008                                                 | 976                          


Non matching value rows:
------------------------

Result-set with 1 row

     #0 ([Date].[Calendar].[Calendar Year].[MEMBER_CAPTION]) | #1 ([Date].[Calendar].[Calendar Semester].[MEMBER_CAPTION]) | #2 ([Date].[Calendar].[Calendar Quarter].[MEMBER_CAPTION]) | #3 ([Measures].[Order Count])
     (Text)                                                  | (Text)                                                      | KEY (Text)                                                 | VALUE (Numeric)              
     ------------------------------------------------------- | ----------------------------------------------------------- | ---------------------------------------------------------- | ----------------------------- 
     CY 2008                                                 | H1 CY 2008                                                  | Q1 CY 2008                                                 | 6082 <> 6080                 

Using NBi to assert calculations based on measures

A few days ago on GitHub, I received a request to explain how to assert the results of some calculations with measures and also how to automate these tests with NBi. This blog post is the complete answer to this question.

To illustrate the case, I’ll use the Adventure Works 2012 multidimensional cube, but you can do the same with any other database. In this cube, you’ve a measure-group with the measures: Internet Gross Profit, Internet Sales Amount, Internet Gross Profit Margin. As you can guess, the last measure is the result of the division of the two firsts (expressed in percentage). My test will assert that this is still the case when I’m slicing by customers’ country.

To achieve this, I’m defining a system-under-test with a result-set defined in a MDX query:

<system-under-test>
  <resultSet>
    <query>
      <![CDATA[
      select
      {
        [Measures].[Internet Gross Profit],
        [Measures].[Internet Sales Amount],
        [Measures].[Internet Gross Profit Margin]   
      } on 0,
      {
        [Customer].[Country].members
      } on 1
      from
        [Adventure Works]
      ]]>
    </query>
  </resultSet>
</system-under-test>

Asserting the calculations’ result can be executed by a all-rows and a predicate where you’ll check that the content of the last measure is equal to the quotient of the two firsts.

Due to the complex names of columns for MDX queries, it’s recommended to use aliases. With NBi, we can define an alias based on columns’ position (starting at 0). The position is 0 will be for the column [Customer].[Country].members, we can skip it. But columns 1 to 3 will receive aliases:

<alias column-index="1">Profit</alias>
<alias column-index="2">Sales</alias>
<alias column-index="3">Margin</alias>

The test will need to compute the quotient between Profit and Sales and check that this value is equal to the value returned by the cube in the column Margin. This can be expressed in the following expression:

<expression name="calculate">
    Round(Profit/Sales, 4) = Round(Margin, 4)
</expression>

The Round function is provided by the underlying library for the evaluation of these expressions: NCalc. In this case, it’s extremely useful to avoid rounding issues during computations. Due to the percentage, I didn’t round to 2 digits after the decimal separator but to 4.

Based on the expression defined above, we can use the predicate true. Each row not validating the equality defined above will return false and not validate the predicate. The test is a all-rows so if any row is not validating the predicate then the test will fail.

Some developers will perhaps try to use the predicate equal in place of true, but unfortunately, at this moment, NBi can only handle fixed value for the equal predicate and it’s not possible to specify a column This limitation is invalidating the approach with equal.

The full code for this test is

<test name="Profit, Sales and Margin">
  <system-under-test>
    <resultSet>
      <query>
        <![CDATA[
      select
      {
          [Measures].[Internet Gross Profit],
          [Measures].[Internet Sales Amount],
          [Measures].[Internet Gross Profit Margin] 
      } on 0,
      {
          [Customer].[Country].members
      } on 1
      from
          [Adventure Works]
      ]]>
      </query>
    </resultSet>
  </system-under-test>
  <assert>
    <all-rows>
      <alias column-index="1">Profit</alias>
      <alias column-index="2">Sales</alias>
      <alias column-index="3">Margin</alias>
      <expression name="calculate">
          Round(Profit/Sales, 4) = Round(Margin, 4)
      </expression>
      <predicate operand="calculate" type="boolean">
        <true />
      </predicate>
    </all-rows>
  </assert>
</test>

The second part of this blog post is about the automation of generation of this kind of tests. Let’s start by defining our test-cases. To define them, I’ll put the aliases that I’d like to use (column alias), the expected formulae (column expression), the exact name of the measure (column measure) and how many digits are needed for rounded comparisons (column round). In this example, I created two test-cases. The first test-case will check that Profit is equal to Sales minus Cost and the last one is asserting that Margin is equal to Profit divided by Sales.

alias;expression;measure;round
Sales,Cost,Profit;Sales-Cost;[Measures].[Internet Sales Amount],[Measures].[Internet Total Product Cost],[Measures].[Internet Gross Profit];2
Profit,Sales,Margin;Profit/Sales;[Measures].[Internet Gross Profit],[Measures].[Internet Sales Amount],[Measures].[Internet Gross Profit Margin];4

To load this CSV file in genbiL, I’ll need to use the load file function:

case load file 'calculations.csv';

Note that in this CSV file each column is separated by a semi-column (;). In the columns alias and measure, I’ve more than one value and each of these values are separated by a coma (,).

To parse this CSV file with genbiL, I’ll need to use the function split. This function is transforming a single value into an array of values using a separator.

case split column 'alias' with value ',';
case split column 'measure' with value ',';

After these two lines of code, the test-cases’ scope consists in two cases and each of them has an array of three elements in the columns alias and measure.

Next steps are straightforward: loading the template (that we’ll compose just after this), generate the tests and save them.

template load file 'calculations.nbitt';
suite generate;
suite save 'calculations.nbits';

Once we’ve the CSV file and the genbiL script, we still need to build a template. There are two tricky parts in this template. The first one is to generate the list of measures in the MDX queries. Elements of this list must be separated by a coma. If you’ve three elements, you’ll need two comas.

select
   {
      [Measures].[Internet Gross Profit],
      [Measures].[Internet Sales Amount],
      [Measures].[Internet Gross Profit Margin]
   } on 0,

To achieve that with the StringTemplate engine, you’ll need to use the separator keyword (doc) for any variable containing an array.

select
   {
      $Measure; separator=", 
"$
   } on 0,

The second tricky part sounds similar but is really different. defining the list of aliases. In this case there is no separator, if you’ve three elements, you’ll need exactly the same xml elements three times. An additional detail is that we’ll need to add some figures starting at 1 and increasing on each new element. Hopefully StringTemplate has the concept of anonymous templates that can be really helpful for this. In this case we’ll explain that for each value contained in the array of column alias, we’ll have to create an xml element alias and add an attribute column-index with an incremental value. Note that the incremental value is automatically assigned to $i$ by StringTemplate and is starting at 1. Each element contained in the array of alias will be assigned to the variable x in the anonymous template. The anonymous template is surrounded by the pipe and the right curly brace.

$alias:{ x | <alias column-index="$i$">$x$</alias>}$

The template will also the StringTemplate functions trunc returning all the elements of an array except the last one and the function last returning the last element of an array.

The full listing for the template is available here under:

  <test name="$trunc(alias); separator=" and "$ to calculate $last(alias)$">
    <system-under-test>
      <resultSet>
        <query>
          <![CDATA[
          select
          {
         $measure; separator=", 
"$
          } on 0,
          {
          [Customer].[Country].members
          } on 1
          from
          [Adventure Works]
          ]]>
        </query>
      </resultSet>
    </system-under-test>
    <assert>
      <all-rows>
        $alias:{ x | <alias column-index="$i$">$x$</alias>}$
        <expression name="calculate">
           Round($expression$, $round$) = Round($last(alias)$, $round$)
        </expression>
        <predicate operand="calculate" type="boolean">
          <true />
        </predicate>
      </all-rows>
    </assert>
  </test>

And voilà, now you just need to run your genbiL script and you’ll get your two tests well generated. Feel free to add new cases!

Automating the testing of Elasticsearch queries with NBi

Since five years, you can run automated tests on your SQL server databases and SSAS cubes with the help of the open-source framework NBi. This framework was extended to support other relational databases (using the OleDb or ODBC drivers) in 2017. In 2018, I’m adding support for NoSQL databases. Earlier this year, I released some extensions for the Graph databases but This new extension is targetting Elasticsearch RESTful search and analytics engine. The code for this extension to the NBi framework is hosted on GitHub.

If you’re used to NBi, you can directly jump to the next paragraph. For newcomers, NBi is an open-source framework dedicated to the testing of BI and data centric solutions: it supports complex comparison of queries results, asserting conditions on each row of a result-set, running ETL (SSIS), validating queries from reports (SSRS) or many other possibilities. On top of this, it has an advanced feature to automate the process of creating test-suites.

In order to setup an environment for testing some queries on an Elasticsearch instance, you must download the version 1.18 of NBi and its extension for Elasticsearch in version 1.0. Unzip the content of the NBi download and then partially override it with the content of the extension in the NBi.Elasticsearch (dlls from both packages must be deployed in a unique directory). If NUnit 2.6.4 is not available on your computer don’t forget to download it. If you need more info about how to setup a NBi’s extension, read the documentation.

When NBi and its extension are installed, create your test-suite with its config and NUnit project files as you’d normally do it for any NBi test-suite (or, if you’re in the hurry, download the files with the examples here, but don’t forget to update the connection-string when trying to run it). If you need more info about how to setup a test-suite, read the here.

For this example, I started an elasticsearch instance and run the sample data from the Bank example.

curl -H "Content-Type: application/json" -XPOST "localhost:9200/bank/_doc/_bulk?pretty&refresh" --data-binary "@accounts.json"

When the environment is correctly configured, you must edit your config file to reference the extension NBi.Core.Elasticsearch.

<configuration>
  <configSections>
    <section name="nbi" type="NBi.NUnit.Runtime.NBiSection, NBi.NUnit.Runtime"/>
  </configSections>
  <nbi testSuite="...">
    <extensions>
      <add assembly="NBi.Core.Elasticsearch"/>
    </extensions>
  </nbi>
</configuration>

The concept of connection-string is not familiar to Elasticsearch but to match with relational databases, we use a concatenation of the usual parameters defined to connect to a Elasticsearch instance with the low level client available in C#. You must provide an url with the hostname, the port, the username and password. The protocol should be elasticsearch at the moment to make a distinction with other databases relying on the http protocol.

elasticsearch://user:password@localhost:9200

In your test-suite, querying a relational database with SQL or an Elasticsearch cluster with a query written in the Query DSL is not different. You’re still using the result-set and query elements. The query is specified within the query.

Elasticsearch queries can return complex results such as hits, aggregations or counts. Currently, NBi support for Elasticsearch is limited to queries returning a hits or aggregations.

This really first test is asserting that the query dedicated to search the 5 persons with the higher balance will effectively returns 5 rows.

<test name="5 highest balances returns 5 rows" uid="0001">
  <system-under-test>
    <resultSet>
      <query>
        <![CDATA[
        GET bank/_search
        {
           "query": {"match_all": { }}
           , "size": 5
           , "_source": ["gender", "age", "balance"]
           , "sort": [ { "balance" : {"order" : "desc"}}]
        }
        ]]>
      </query>
    </resultSet>
  </system-under-test>
  <assert>
    <row-count>
      <equal>5</equal>
    </row-count>
  </assert>
</test>

In the second test, the same query than in previous example should return rows with an age between 20 and 40 and a balance greater than 48.000$

<test name="5 highest balance" uid="0001">
  <system-under-test>
    <resultSet>
      <query>
        <![CDATA[
        GET bank/_search
        {
           "query": {"match_all": { }}
           , "size": 5
           , "_source": ["gender", "age", "balance"]
           , "sort": [ { "balance" : {"order" : "desc"}}]
        }
        ]]>
      </query>
    </resultSet>
  </system-under-test>
  <assert>
    <all-rows>
      <combination operator="and">
        <predicate operand="age">
          <within-range>[20;40]</within-range>
        </predicate>
        <predicate operand="balance">
          <more-than>48000</more-than>
        </predicate>
      </combination>
    </all-rows>
  </assert>
</test>

The next test is checking the result of an aggregation. More specifically than the the three states with the higher average for the balance are Washington, Alabama and Rhode Island but also that the count of documents and the average balance are more or less in the expected range.

<test name="Top 3 of average balance by state" uid="0002">
  <system-under-test>
    <resultSet>
      <query>
        <![CDATA[
        GET /bank/_search
        {
          "size": 0,
          "aggs": {
            "group_by_state": {
              "terms": {
                "field": "state.keyword",
                "size" : 3,
                "order": {
                  "average_balance": "desc"
                }
              },
              "aggs": {
                "average_balance": {
                  "avg": {
                    "field": "balance"
                  }
                }
              }
            }
          }
        }
        ]]>
      </query>
    </resultSet>
  </system-under-test>
  <assert>
    <equalTo tolerance="1">
      <resultSet>
        <row>
          <cell column-name="key">WA</cell>
          <cell column-name="doc_count">(+)</cell>
          <cell column-name="average_balance">43265</cell>
        </row>
        <row>
          <cell>AL</cell>
          <cell>6</cell>
          <cell>41418</cell>
        </row>
        <row>
          <cell>RI</cell>
          <cell>[5;10]</cell>
          <cell>40040</cell>
        </row>
      </resultSet>
    </equalTo>
  </assert>
</test>

FoF-running-test-suite

Our test-suite is green … time to write some additional tests! Feel free to explore the other kind of tests that NBi is supporting and report your ideas for improvement at the <a href="http://The ” target=”_blank”>GitHub issues for NBi.Elasticsearch

To know more about NBi, check the website at www.nbi.io and if you’ve any question or suggestion, feel free to ask on Twitter or on the Github repository (section “issues”). The code of this extension is also available on Github.